01 / Context & question
A detection system has to flag attacks without burying analysts under false alarms.
Signature-based tools recognise known attacks well, but not their variants. A machine-learning model can learn behaviour instead: packet volumes, timing, duration, TCP flags.
Completed by a three-student ESAIP team in the Technical Project course in 2024, the project received 15/20. The case study covers data analysis, modeling, evaluation and the demo application without publicly assigning team work to one individual.
Network flow: each row is one exchange described by 64 CICFlowMeter statistics such as packet counts, timing, TCP flags and activity. The model acts as an IDS here by classifying each flow as benign or attack.
Question: can these statistics distinguish benign traffic from attacks while balancing missed attacks and false alarms?
02 / Key takeaways
The model detects most attacks in the dataset, but the real difficulty is the boundary between benign traffic and Infiltration.
14,540 of 15,872 attack flows in the test set are flagged.
1,781 of 10,642 benign flows are flagged incorrectly, still too high for direct unattended use.
Almost every other family is detected at 99.9% or better; Infiltration looks much more like normal traffic.
Operational meaning: the global score is good, but it hides an important asymmetry. The model is better viewed as an analyst-prioritization layer than an automatic decision engine.
03 / Exploration & quality checks (EDA)
Exploration reveals massive duplicates, contradictory labels and one attack class that looks like normal traffic.
- the class distribution: benign traffic and ten attack types (FTP and SSH brute force; Hulk, GoldenEye, Slowloris, SlowHTTPTest denial of service; HOIC and LOIC-UDP DDoS; botnet; Infiltration);
- constant columns and impossible values (negative durations);
- exactly identical rows;
- identical flows carrying different labels;
- the destination ports of each class.
Round counts per class: 70% attacks.
27% of rows.
Same values, different labels.
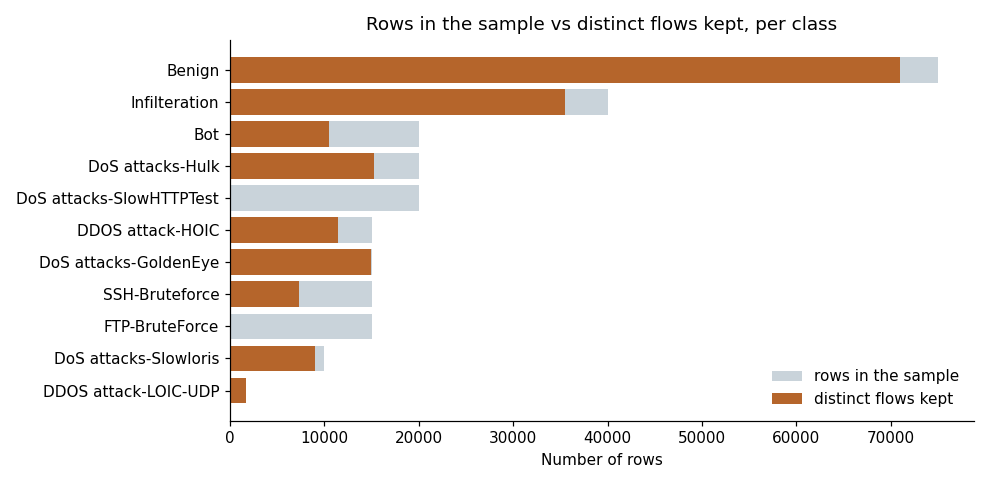
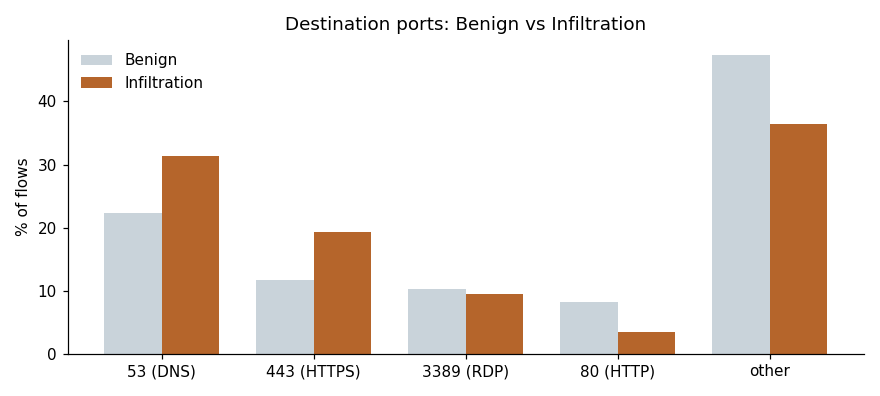
Duplicates must go before the split: otherwise the same flow would be learned and then “recognised” at test time, inflating the score. The high share of attacks (far more than in reality) rules out judging on accuracy alone. And the resemblance between Infiltration and normal traffic anticipates where the errors will concentrate.
04 / Cleaning
Remove what would distort the evaluation, keep what carries meaning.
- removed the 66,935 exact duplicates;
- removed the 3,036 rows whose identical values carry different labels: no model can be right on both;
- removed one row with a negative flow duration (measurement error);
- removed 8 constant columns, which carry no information;
- kept the −1 value of
Init Bwd Win Byts, which means “TCP window not observed” and remains useful information.
After full cleaning.
Flow statistics.
Still far more than in reality.
On this clean data, the evaluation had to be organised before training any model.
05 / Training, validation and test split
Three separate sets, each with a precise role.
Validation compares models and chooses the threshold without touching the test set. The test stays untouched until the end. The split is stratified to preserve attack-family proportions.
A fingerprint check confirms that no flow appears in two sets at once.
06 / Three models, one rule for judging them
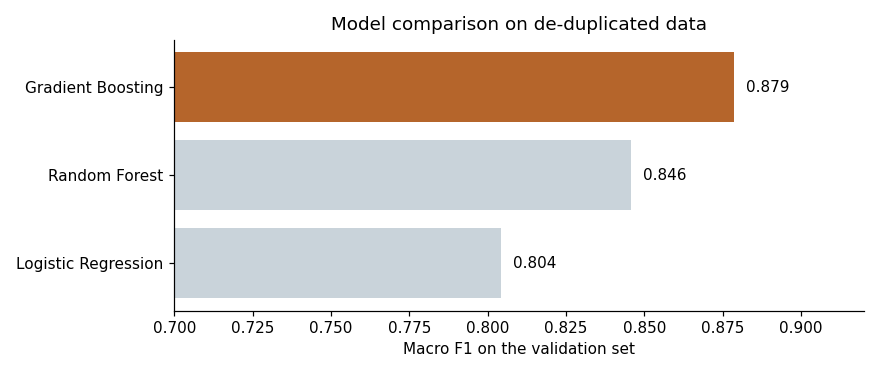
A linear model, a forest of trees and gradient boosting.
Weighs the statistics to separate benign from attack with a simple boundary. Durations range from microseconds to minutes, so A log transform is applied first, followed by scaling.
Many decision trees, learned on different draws of the data, voting together.
Trees built one after another, each correcting the previous ones’ errors.
The models are compared with three complementary measures: detection rate, false-alarm rate and Macro F1, which balances performance across benign and attack traffic.
Transformations and models only see the 123,730 training flows; their settings are judged on validation only.
07 / Choosing the alert threshold
The threshold expresses the trade-off a security team has to accept.
The alert threshold is the probability above which a flow is called an attack. Lowering it catches more attacks but raises more false alarms; raising it does the opposite.
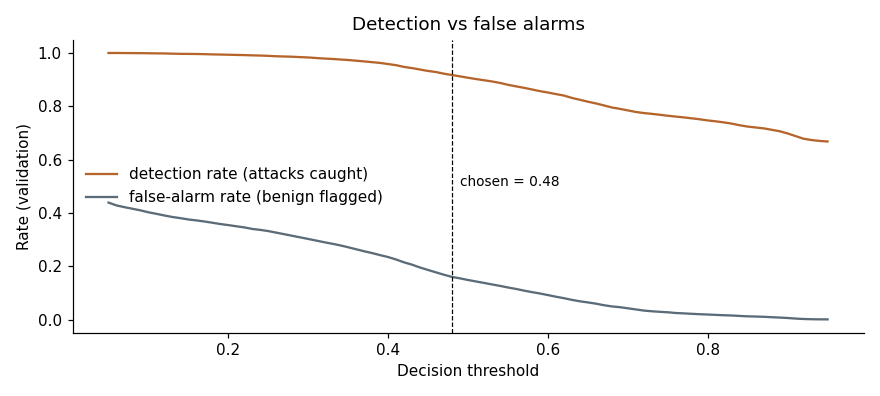
The selected threshold is 0.48, the threshold that maximises Macro F1 on validation. It was frozen before any evaluation on the test set.
08 / Final evaluation on the test set
On unseen flows, the model detects 91.6% of attacks but still generates a 16.7% false-alarm rate.
14,540 attacks detected out of 15,872
1,781 benign flows flagged out of 10,642
balanced overall performance across benign and attack traffic
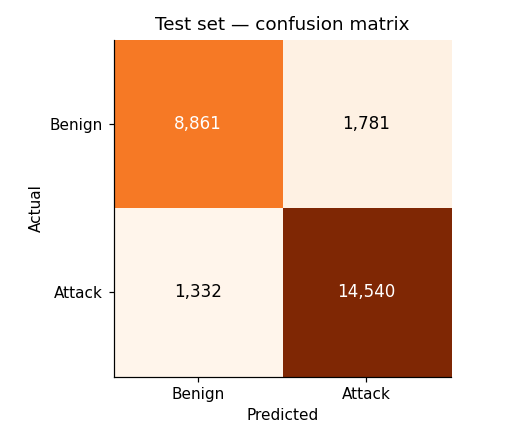
Alert precision is 89.1%, so roughly one alert in nine is false. ROC-AUC reaches 0.964, showing strong ranking ability overall, but the aggregate score still hides which attack families remain difficult.
09 / Understanding the errors
The main weakness is not a noisy attack family: it is Infiltration, because its traffic looks much more like benign activity.
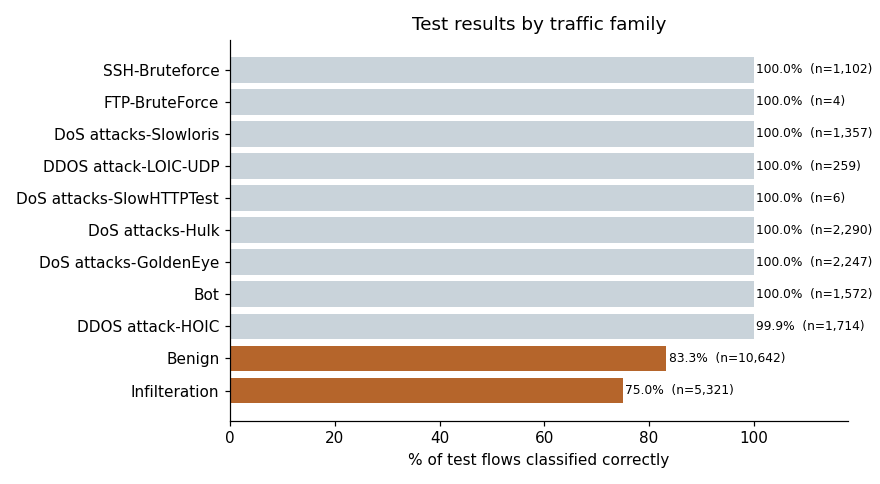
This matches the initial exploration: highly characteristic service attacks are easier to separate, while Infiltration uses services that also appear in normal traffic. Published work on CSE-CIC-IDS2018 has also documented labeling issues, so part of the remaining error may come from the dataset itself.
The model is not simply reading the port
Removing destination port reduces validation Macro F1 by less than 0.01, so behavior statistics carry most of the signal.
Some families are tiny
FTP-BruteForce and SlowHTTPTest contain only 4 and 6 test flows. A 100% rate on those classes is therefore fragile.
10 / Demo application
A local interface that uses the same model and threshold as the evaluation.
The application loads a model artifact containing the trained model, the ordered 64 features and threshold 0.48. A CSV can be scored row by row, or the 44-flow demo set can be launched directly from the interface.
- the model reloaded from disk produces the same verdicts when the input columns are reordered;
- checks stop missing columns, non-numeric values or empty files before scoring;
- the local run on the 44 demo flows returns 38 attack flags, 6 benign flows and 95.5% agreement with the supplied labels.
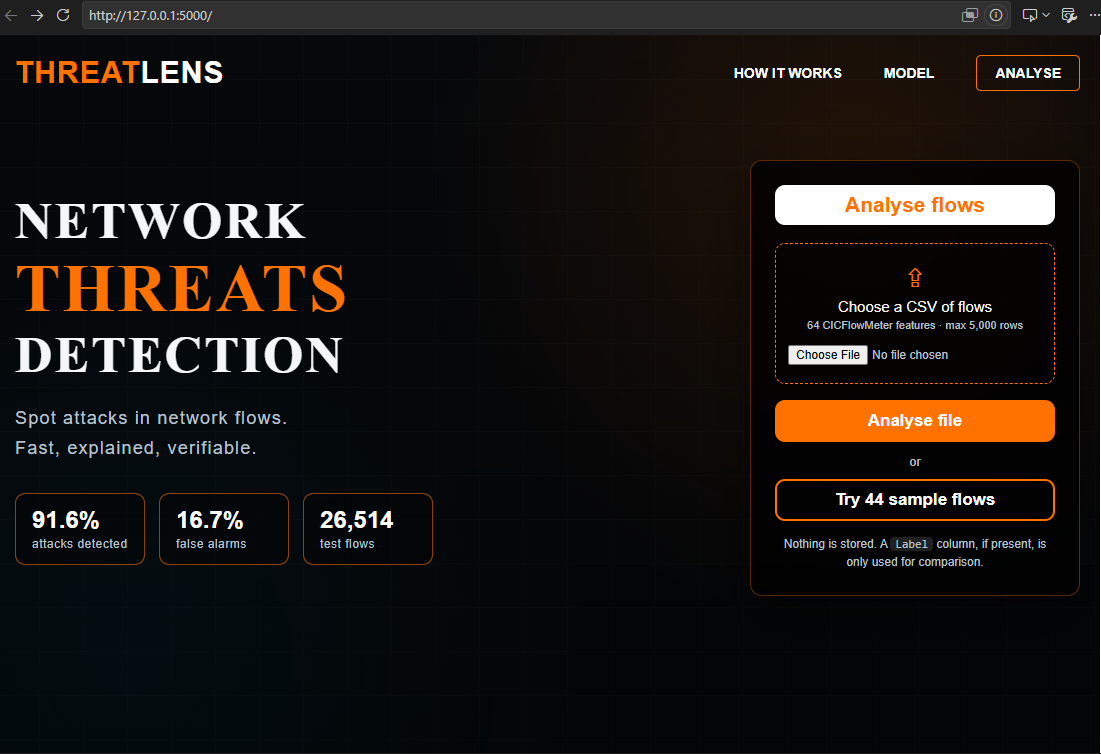
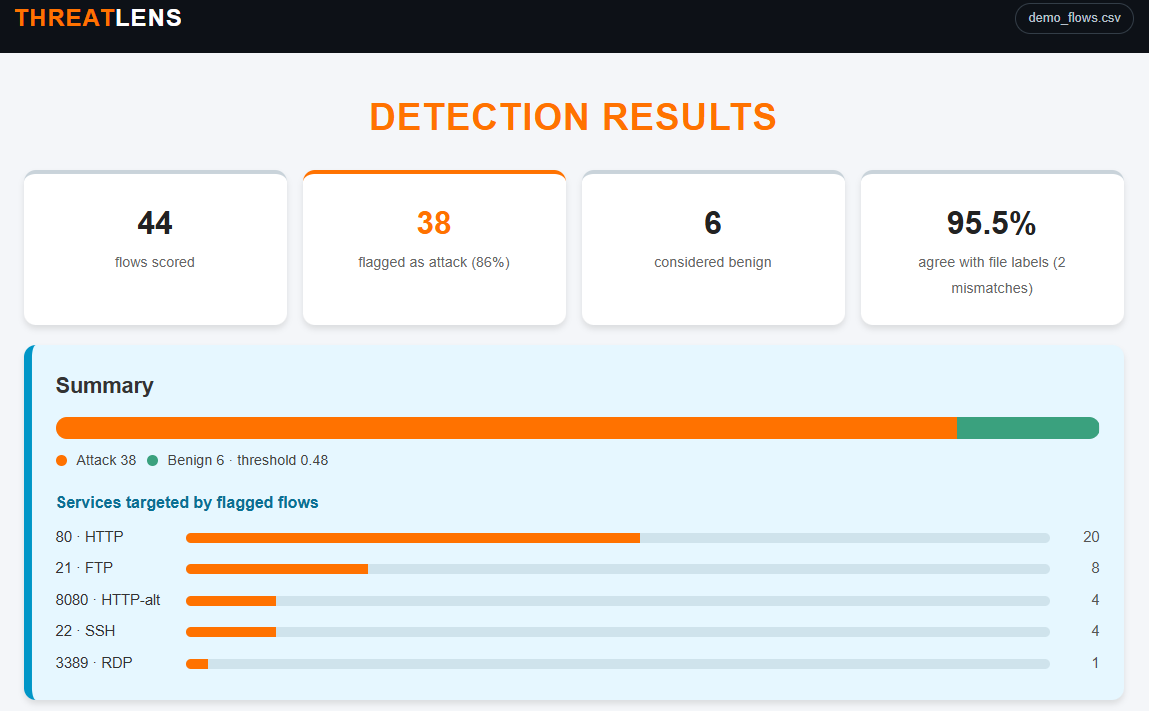
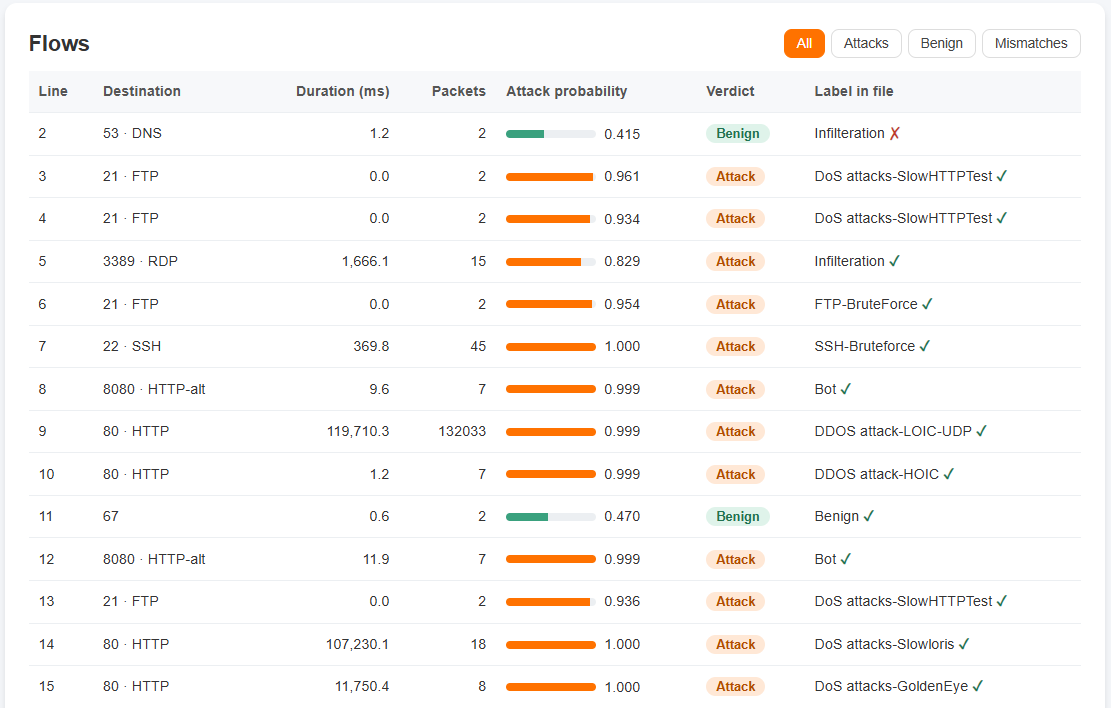
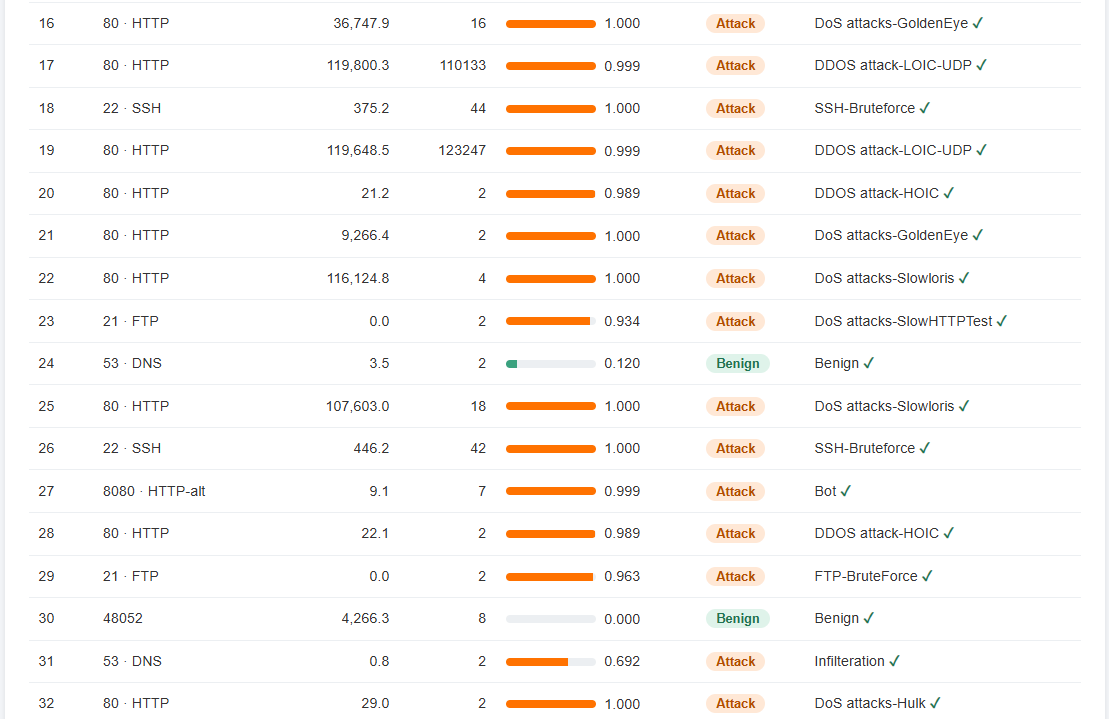
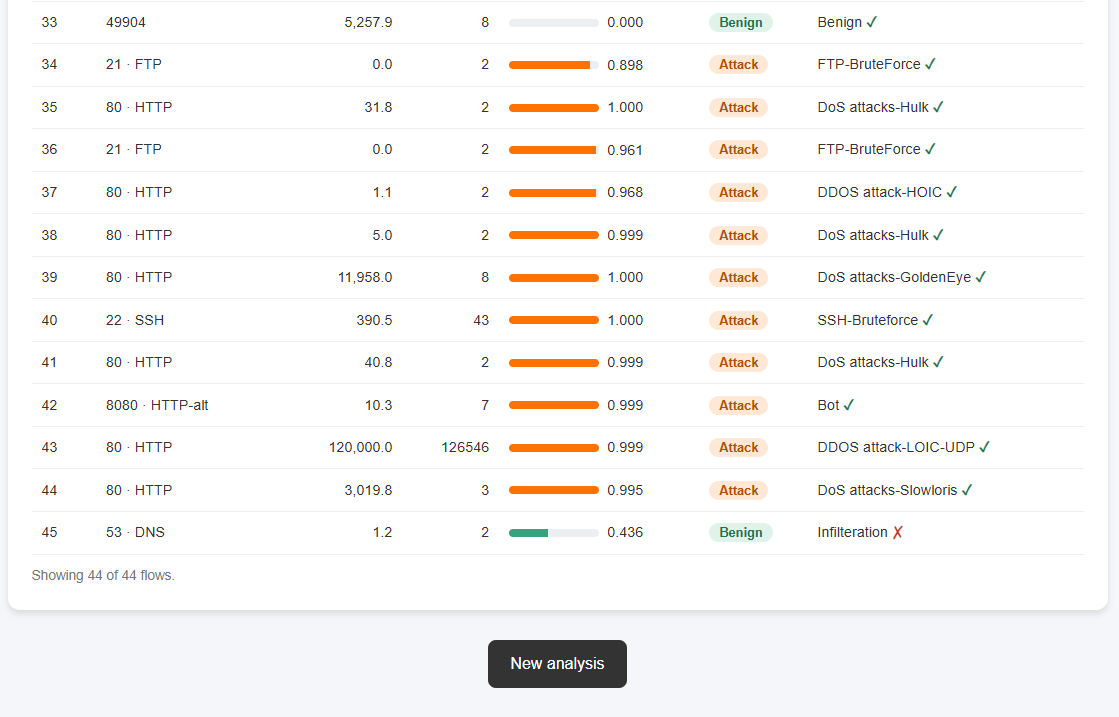
The Flask demo runs locally: it loads CSV flows and tests 44 sample flows, with no authentication, no network exposure and no continuous traffic monitoring.
11 / Real-world value, limits & lessons
A triage tool to help analysts interpret alerts.
In a SOC (security operations centre), this kind of model would act as a triage layer: it flags flows for review alongside signature-based detection. The threshold would be set from the team’s tolerance for false alarms on real traffic volumes.
- Public benchmark traffic used in a controlled lab.
- Artificial attack share (60%): real-world precision would differ.
- Questionable Infiltration labels.
- Flow statistics exist only once a flow ends: no packet-level detection.
- The traffic is not specific to IoT devices, despite the initial IoT use-case framing.
A score is only worth something if the data is clean and the application serves exactly what was evaluated. That discipline (check, separate, validate before shipping) is the same as in analytics engineering, where a transformation that runs differently in production produces wrong numbers nobody notices.
Going further
A stronger follow-up would test the model on another capture day or dataset, recalibrate the threshold on a realistic benign/attack ratio and monitor drift once in service. The notebook details every step and its outputs.