01 / Overview
The same issue existed at both ends of the chain: too much data was being reprocessed.
HortiTrace uses a PostgreSQL warehouse to produce balance reports. Once the central transaction table reached 6.3 million rows, full reloads and repeated reporting calculations became increasingly expensive.
Keep existing reports unchanged.
ERP sources, the MyReport layer and user workflows had to remain compatible.
Do less work on every run.
Reduce the amount loaded and scanned instead of optimizing one isolated query.
02 / MyReport in production
MyReport was the BI backbone of the internship, not just a reporting tool.
I worked across several modules of the MyReport BE suite, from warehouse loading to operational monitoring, report development and distribution. That continuity between ETL, data modeling and BI consumption is a major reason this project now represents my Analytics Engineering positioning.
MyReport Data
ETL, source models and migration from full reload to incremental loading.
Administrator
Execution monitoring, scheduling, operational checks and day-to-day administration.
Builder
Development, maintenance and validation of business reports in the Excel environment.
Messenger
Automation and control of report distribution to operational teams.
Page
Creation and maintenance of visual dashboards for operational monitoring.
Center
Consumption and verification of business indicators, dashboards and validated operational outputs.

Simplified functional diagram without confidential internal details.
03 / Diagnosis
The ETL reloaded 6.3M rows on every cycle although only recent records could still change.
Full reload
~30 minutes per cycle and 6.3 million transaction rows processed again.
Expensive balance reconstruction
~6.1 million rows scanned and more than one minute for some reports.
04 / Architecture
I separated ingestion logic, stable reads and the analytics-serving layer.
The original transaction model was preserved. MyReport Data was reconfigured to load only the recent window, while derived physical tables provided stable reads and historical pre-aggregation. The MyReport reporting layer continued to operate without any report changes.
The trick wasn’t to make the server work harder. It was to stop asking it to repeat itself.
GUIDED READING · ARCHITECTURE
Two architectures, one goal: keep business reports unchanged.
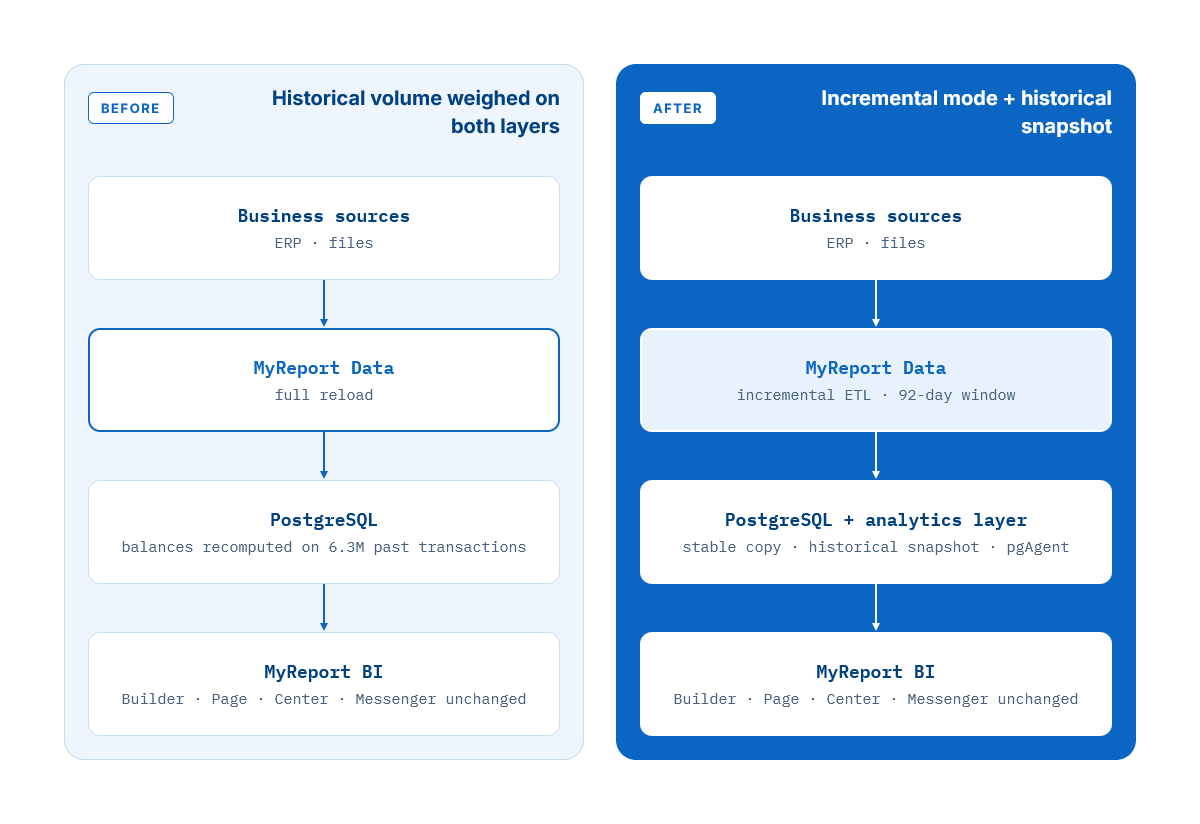
Incremental loading
Reload only the last 92 days because older ERP records can no longer be modified.
Stable copy
Build in staging and atomically rename so reports never read a partially refreshed table.
Pre-aggregated reporting
Pre-aggregate historical balances before combining them with recent transactions, sharply reducing scan volume.
05 / Engineering decisions
The architecture followed the constraints of the existing production system.
Full-reload cost grew with the cumulative history. The source system’s immutability rule provided a reliable boundary for restricting processing to records that could still change.
Choice: reload by creation date over a rolling 92-day window, including a two-day safety margin around the three-month immutability rule.
A materialized view would have been fragile around weekly MyReport source rebuilds and their dependencies.
Choice: an independent physical table refreshed in a controlled way.
TRUNCATE + INSERT could expose an empty or partial table for several minutes.
Choice: build alongside the active table and switch with a rename operation.
06 / Project management
Technical autonomy, shared validation and controlled decisions.
As the primary developer on the optimization project, I led the diagnosis, design and implementation with a high degree of autonomy under my company supervisor’s oversight. Progress, issues and technical choices were discussed through regular debriefs and weekly reviews of roughly 30 to 45 minutes.
These exchanges connected technical decisions to operational consequences. Major milestones, validation results and the production move were reviewed before the Go/No-go decision.
Diagnosis & design
Measure the existing system, identify root causes and frame the two target architectures.
Development & iteration
Build in the test environment, resolve discrepancies and revalidate after each major decision.
Validation & release
Run the seven-test protocol, review the results with the company supervisor, confirm the Go/No-go and deploy in dependency order.
Documentation
Maintain operating, renewal and recovery procedures in parallel so the solution remained transferable.
Milestones & dependencies
Tracked in Notion through a timeline of phases, milestones and dependencies between design decisions and implementation work.
Decision gates
Zero data discrepancy acted as the promotion criterion, with validation required before a component moved to the next stage.
Risk register
Data integrity, reporting continuity and ETL-tool compatibility were tracked with dedicated mitigation measures.
07 / Production release
A production release prepared, checked and executed step by step.
The April 3, 2026 production release followed a prepared sequence:
- synchronize test data;
- run the seven controls;
- hold the technical Go/No-go review;
- deploy objects in dependency order;
- validate production data;
- confirm the reports;
- only then enable pgAgent jobs.
08 / Validation
Performance only mattered if the results stayed identical.
Balances by partner
Compared balances for roughly 6,425 logistics partners.
Partner × item
Compared roughly 37,500 partner-item combinations.
09 / Results
The gain came from structurally reducing unnecessary work.
Zero balance discrepancies, no report modifications and no operational disruption observed during the post-release observation period.
Assessment & recognition
Two signals complement the technical metrics: the final-year project assessment and direct recognition from the company.
Overall final-year internship assessment combining two supervisor evaluations and the MSc defense.
Awarded by HortiTrace in addition to the standard internship compensation.
Operational conclusion: the gain does not come from a more powerful server, but from an architecture that stops reprocessing history unnecessarily. The numbers stay identical and existing reports remain unchanged; for business users, the difference is faster data availability and much more responsive reporting.
10 / Takeaways
This project summarizes my Analytics Engineering positioning.
Engineering side
- Performance diagnosis
- Incremental PostgreSQL ETL
- PL/pgSQL and pgAgent
- Production release and rollback thinking
- Production validation
Analytics side
- MyReport Data & source models
- Builder · Page · Center · Messenger
- Reporting-oriented pre-aggregation
- Reduced query cost
- Measured business impact
Confidentiality: the source code belongs to HortiTrace SAS. This case study presents architecture, decisions and measured results without exposing internal names or proprietary implementation details.