01 / Project & questions
Understand twenty years of food prices in Cameroon before trying to forecast them.
The World Food Programme dataset contains 66,100 valid price observations from January 2005 to February 2025 across 83 markets, 55 commodities and 9 regions. The goal was to understand how prices evolved, where the strongest differences appeared, which commodities were the least stable and whether a seasonal pattern emerged.
usable price observations
January 2005 to February 2025
across 9 regions
Forecasting comes only after the descriptive work. The first objective is to explain what the historical data actually shows.
02 / Preparation
Make dates, prices and categories comparable before drawing conclusions.
I cleaned the dates, converted USD prices to numeric values and checked dataset coverage. EDA, exploratory data analysis, is used here to identify missing values, uneven coverage across markets and commodities, and price dispersion.
Clean
Keep usable observations and harmonize data types.
Aggregate
Group by the level required by the question: month, commodity, market or region.
Compare
Read trends, dispersion, geography and seasonality without mixing incompatible levels.
This preparation turns a raw price history into results that can actually be interpreted.
03 / What the analysis reveals
Food prices do not follow one common dynamic: product, unit, place and period all change the picture.
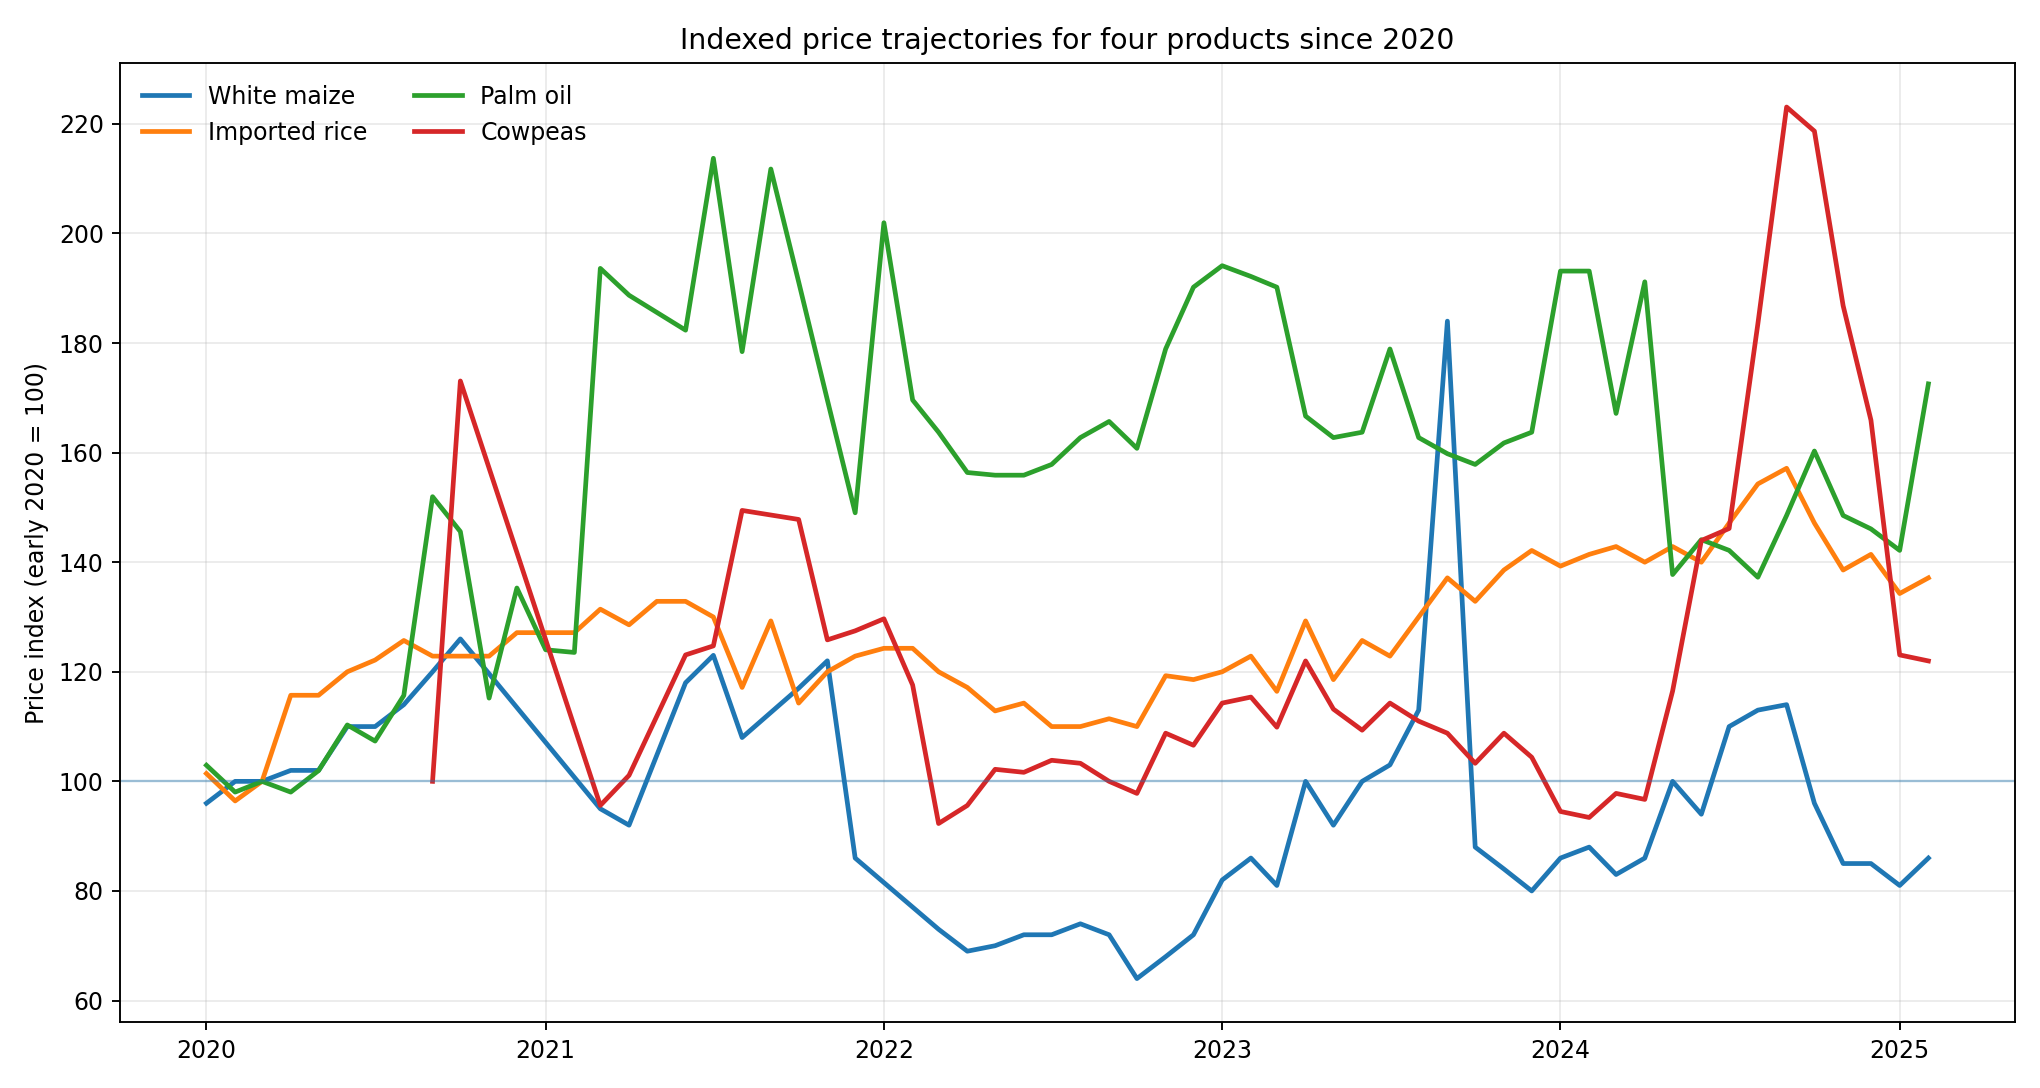
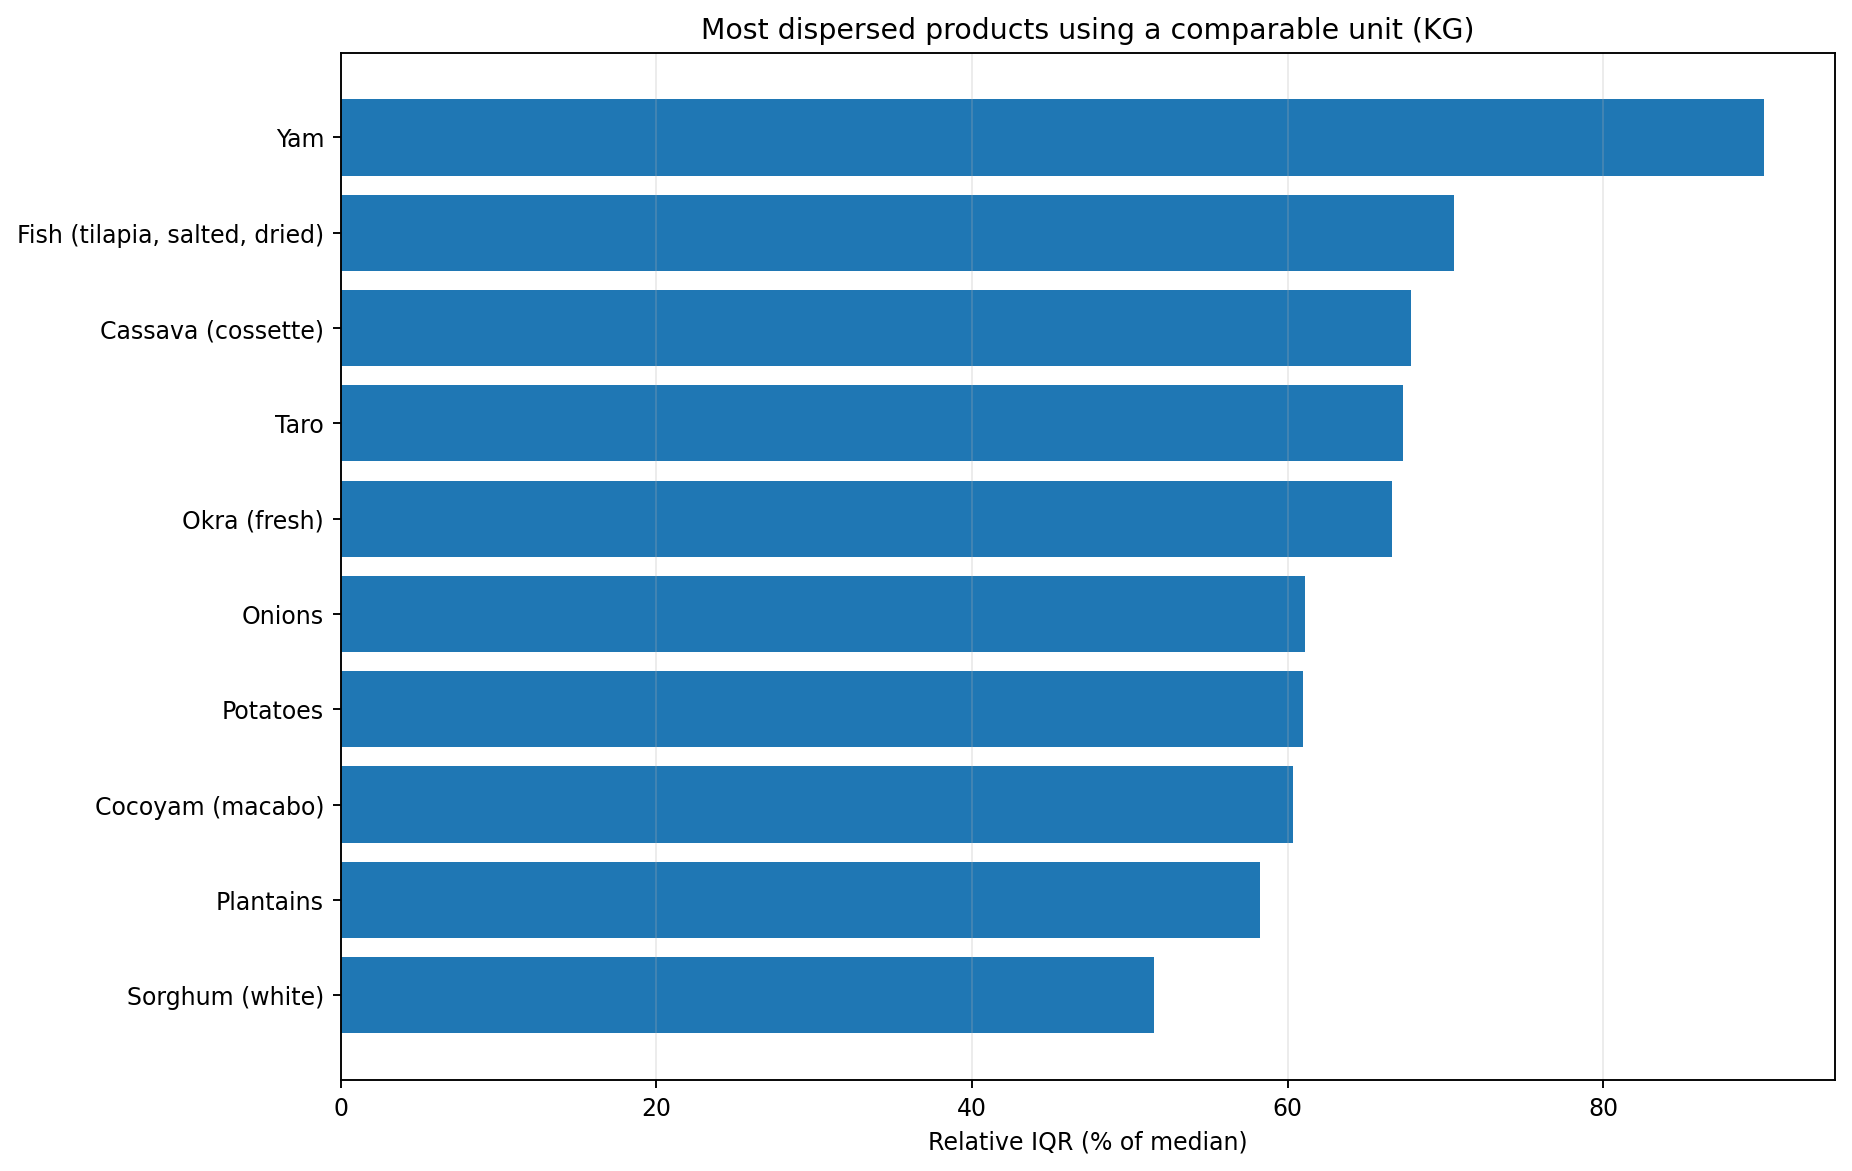
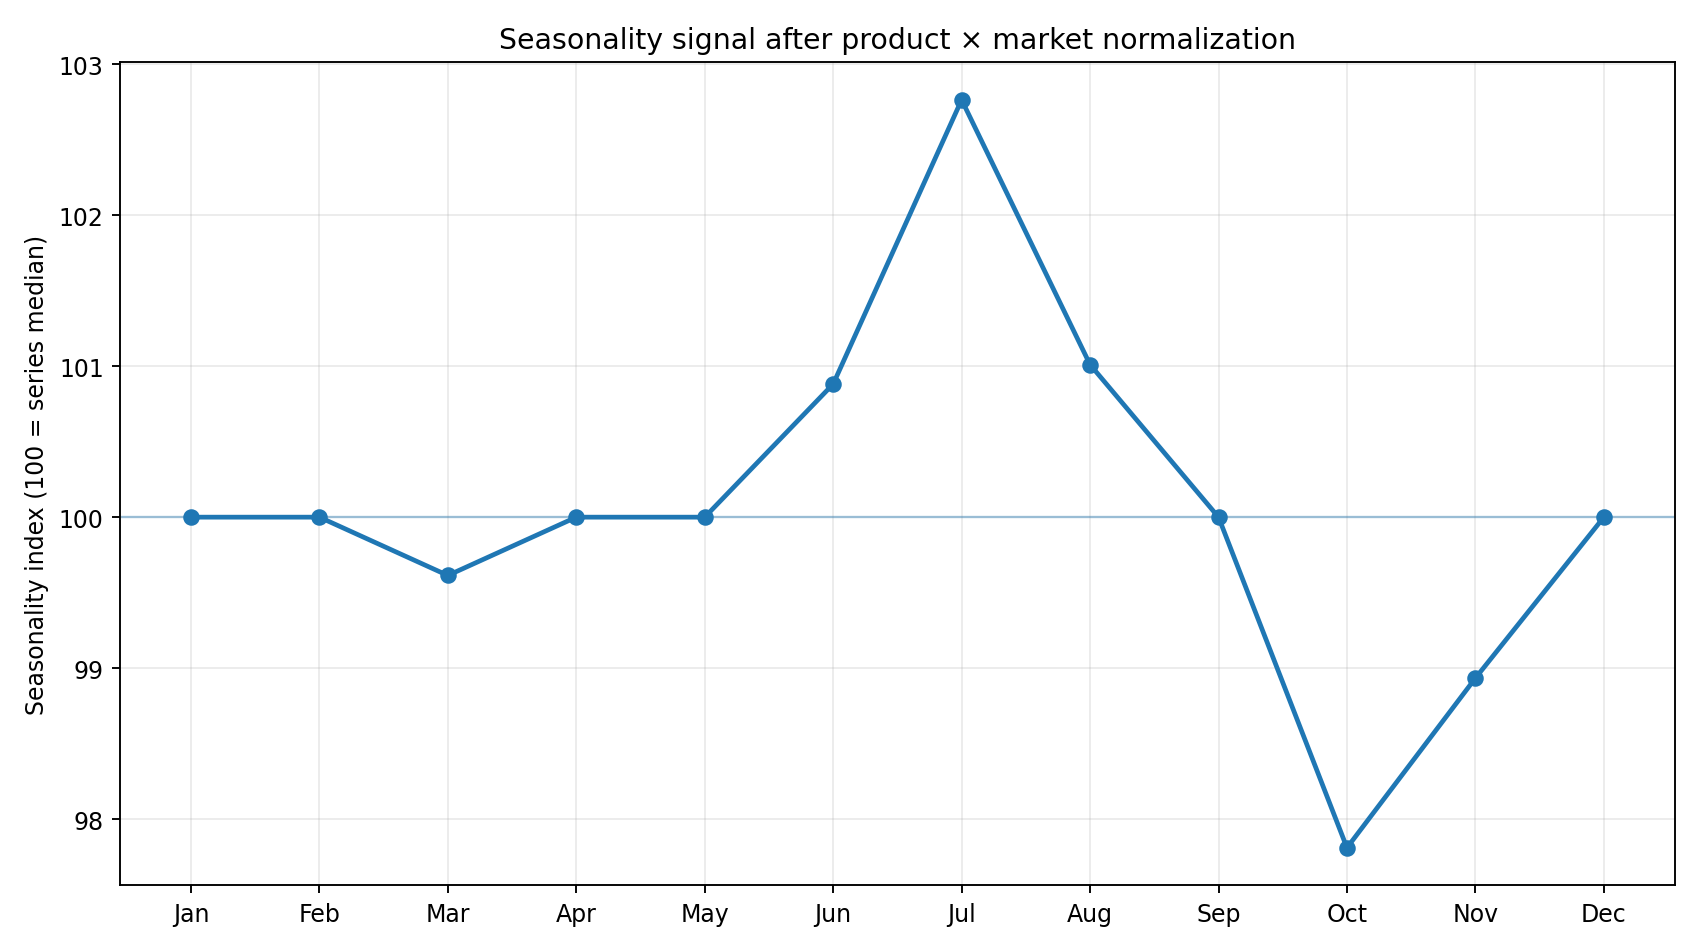
To make comparisons more defensible, the charts below avoid directly comparing absolute prices measured in different units. Trends are indexed, volatility is scaled by the median, and seasonality is normalized within product × market series.
Indexing each series to 100 at the start of 2020 makes the trajectories comparable despite different units. The main finding is that products react very differently across the same years.
Among frequently observed KG products, IQR divided by the median highlights yam, salted/dried tilapia, cassava cossette and taro. The metric compares spread relative to each product’s own price level.
After product × market normalization, July and August sit slightly above typical levels while October and November are lower. This suggests seasonality without proving harvest or rainfall as the cause.
04 / Exploratory forecasting
Prophet extends the series, but uncertainty is also a result.
Prophet is a time-series model combining trend and seasonality. In this project it was fitted separately to maize, imported rice and oil.
Weak direction, wide uncertainty
The series shows an older peak followed by a decline. The 2025 extension is fairly flat, but the wide uncertainty interval means the model does not provide a strong precise signal.
Slight increase, but fragile
After a spike around 2020 and a later decline, Prophet suggests a modest upward direction. The wide band makes that direction uncertain.
The most regular of the three
The series rises more steadily before flattening. The resulting short-term extension is more stable than for maize or rice, while remaining exploratory.
Forecasting is not certainty
The intervals around the central line matter as much as the line itself: some series are clearly less predictable than others.
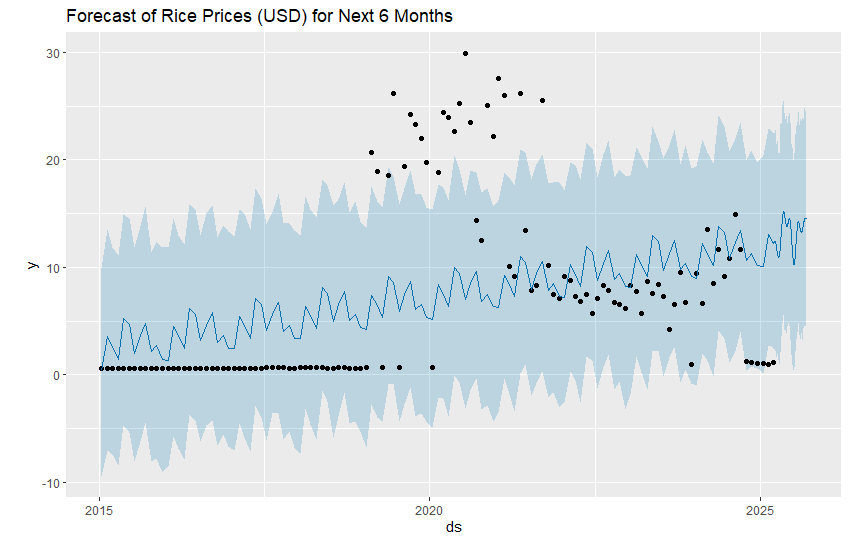
These plots are useful for exploring direction. A forecasting-focused extension should work directly at monthly frequency and measure performance on a held-out time period.
05 / Limits
The findings describe the available dataset, not an official food-price index.
- Coverage ends in February 2025, so analyses labelled “2025” do not represent a full year.
- Observed commodities and markets differ across regions; a raw regional mean is not a standardized price basket.
- The relationship between food prices and CPI depends strongly on aggregation choices and should not be interpreted causally.
- The Prophet work is exploratory: no production service, systematic backtesting or drift monitoring.
06 / Conclusion
The main result is the diversity of price dynamics, not one national average.
Across twenty years of records, trajectories differ strongly by product and period. The normalized analysis also shows large differences in relative volatility and a remaining seasonal signal after partial control for product × market composition.
Price analysis becomes misleading when products, units and markets are mixed without care. The project taught me to choose aggregation based on the question, check whether a comparison is truly comparable and treat uncertainty as a result, especially in the Prophet section.